what we did
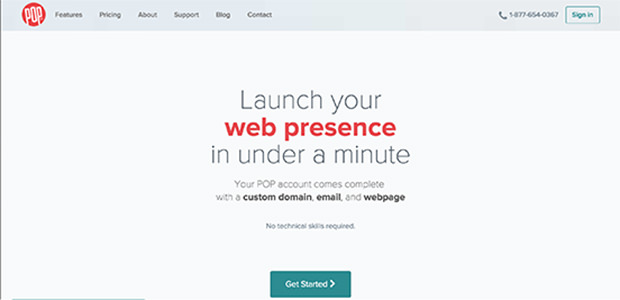
We kicked off by running some competitive analysis on other solutions in the market. The idea was to highlight any pain points or opportunities that could be exploited from the signup and onboarding processes on competitors’ solutions.
We found quite a few – confusing pricing, unclear explanation of all the product features and complex user interfaces that did anything but streamline the process of getting your business online. Using that as a framework, we could compare specific conversion points within our client’s product to evaluate acquisition, activation and retention.
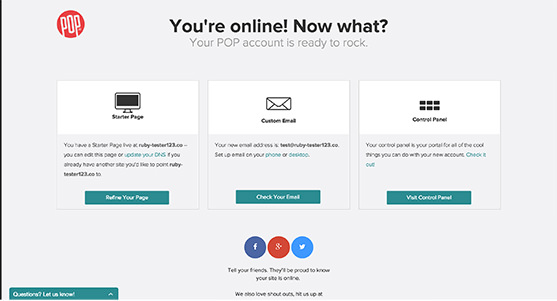
Based on these findings, we established a baseline set of KPIs and metrics to monitor. After identifying the most optimal data sources and analytics tools to use, we tagged all the relevant steps and micro-conversions throughout the customer journey. This meant testing and debugging the tags, sense checking the data against other sources and explaining any discrepancies we found in the data.
Once we established confidence in the new tagging, we could move on to building a robust set of reports within Kissmetrics and Google Analytics. These would give us segmented views of customer data by country, demographics. We also setup a base set of cohort reports by month and campaign.
what happened
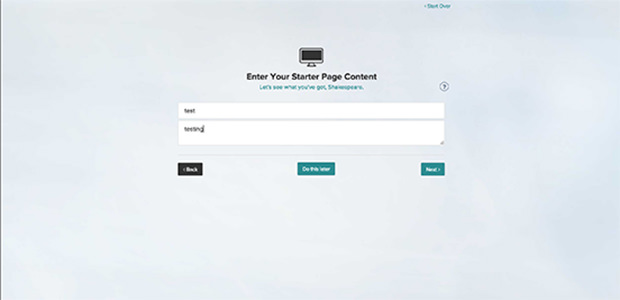
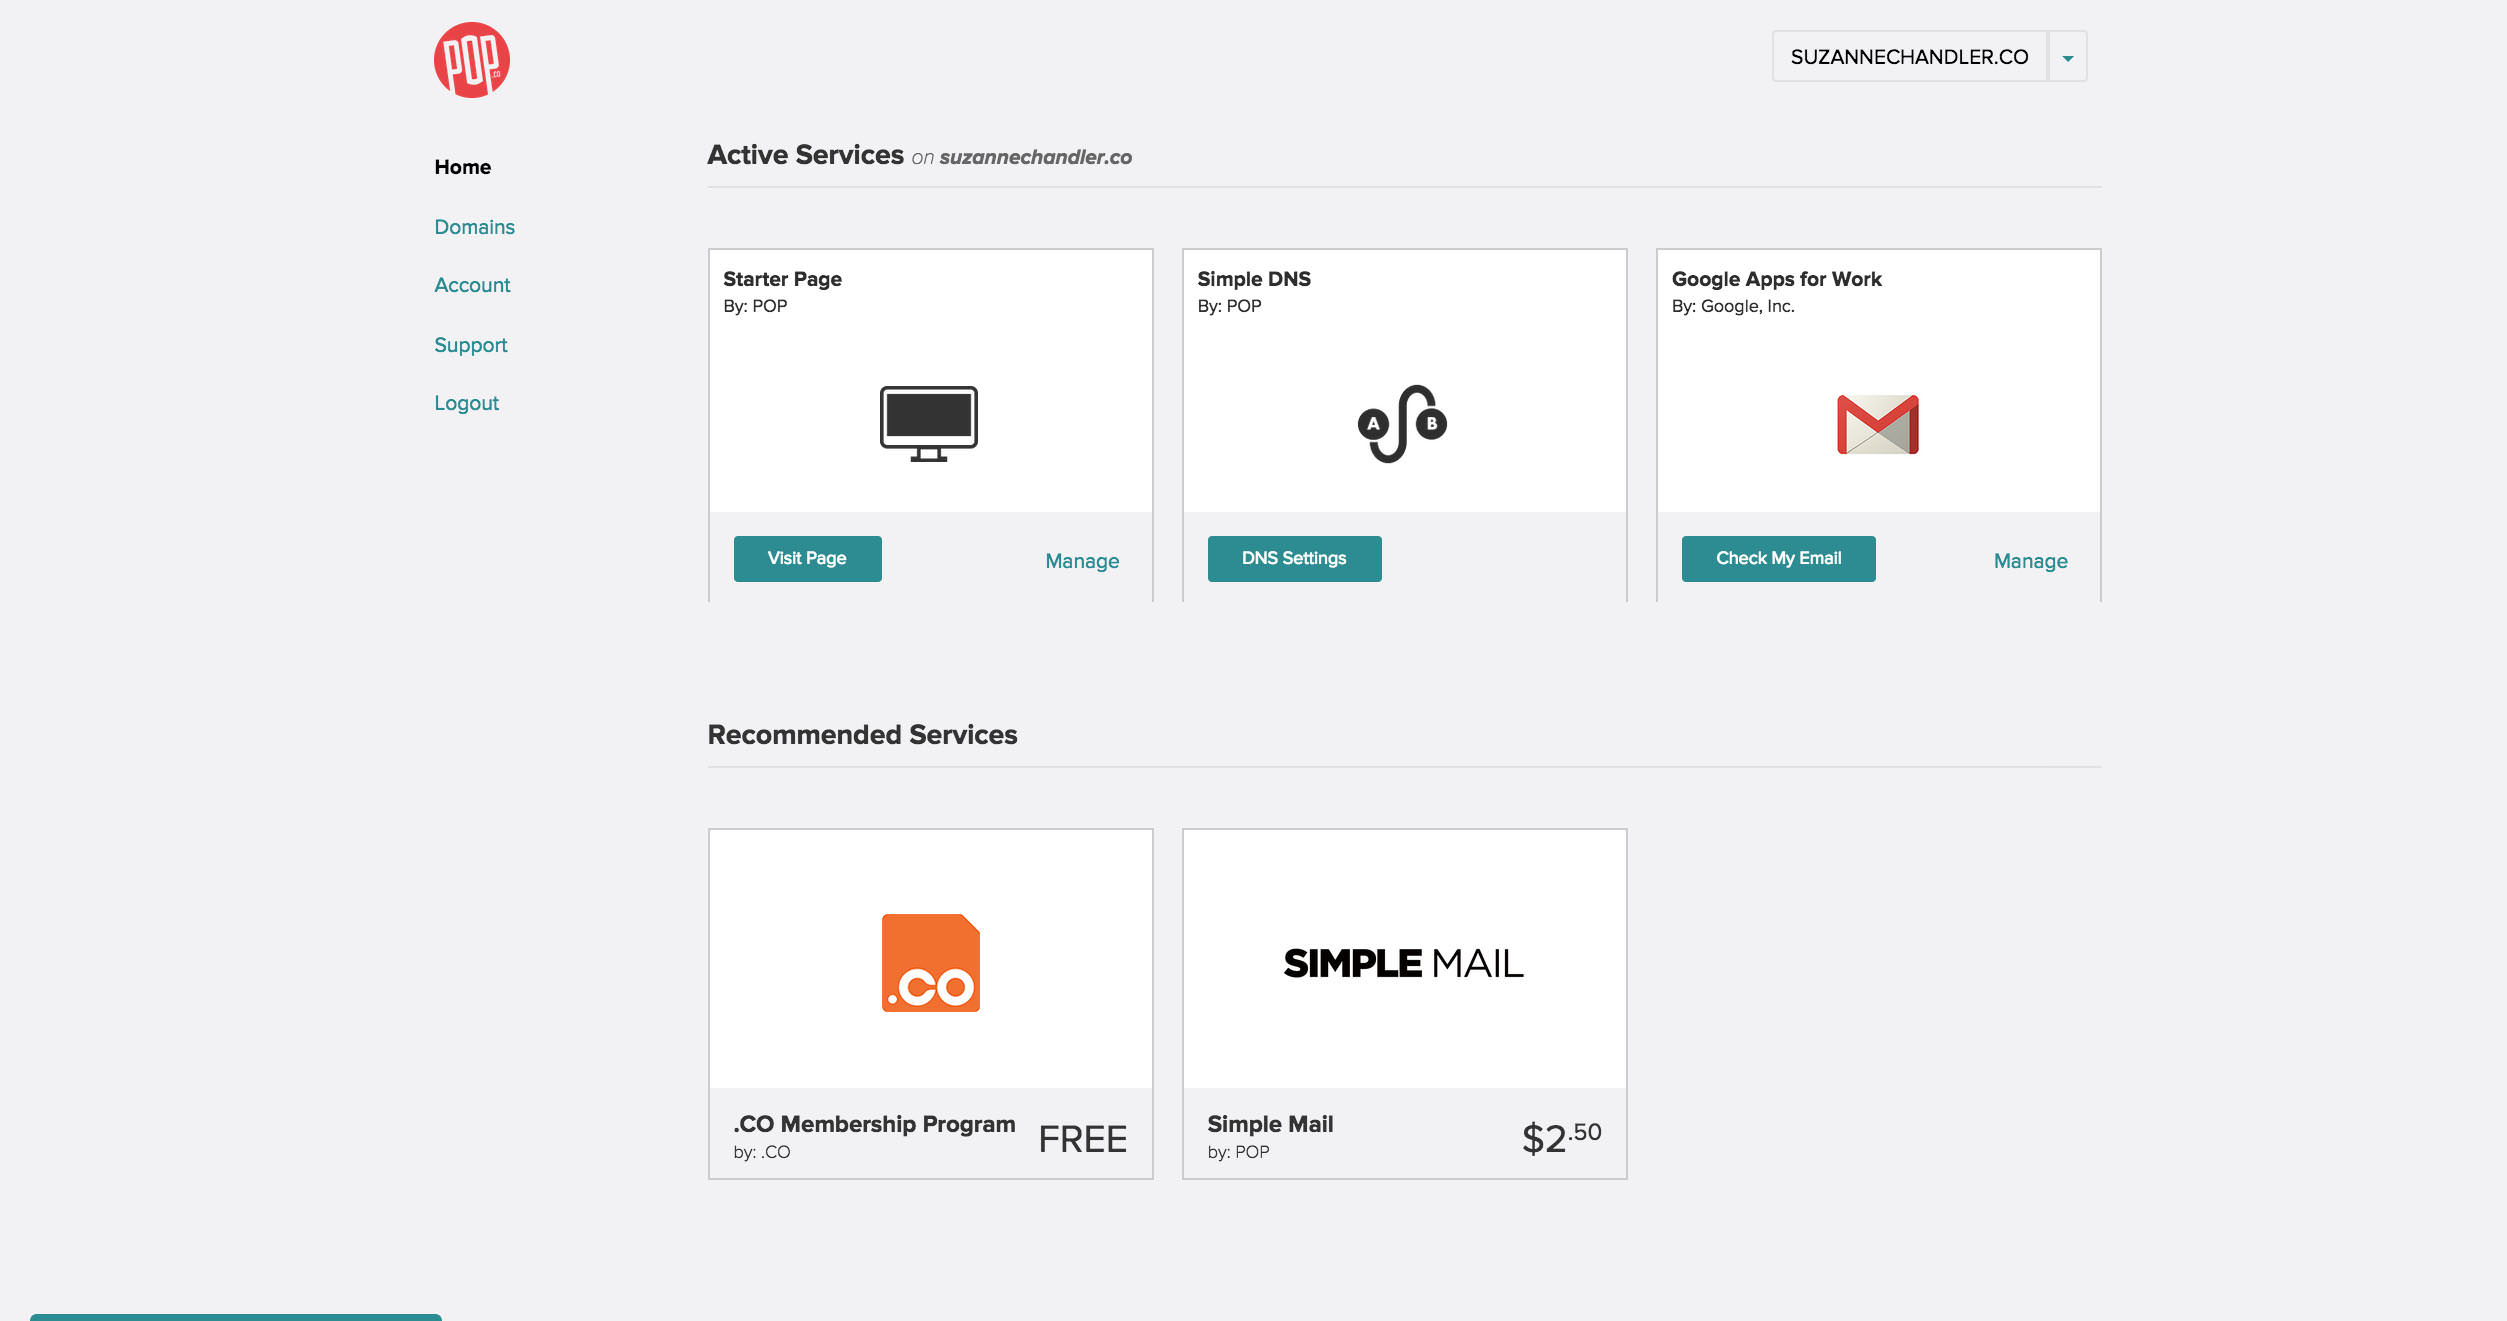
From the data we collected, we realized that if we could get users to interact early with the starter page during onboarding, that would increase the likelihood of converting them to paying customers by up to three times. Based on insights such as this and through continual monitoring of the reports we setup, the POP team was able to optimize the user experience further for better uptake and engagement on the starter page option.